Source: www.lajollabridge.comMatthew Kidd
Slams are not rare. Double dummy, an amazing 13.6% of hands contain a slam (or grand slam). Half this time there is a slam for your side (both sides have a slam only 0.01% of the time). This means there are an average of 1.84 slams for your side in a 27 board session. They might not all be biddable and some may be anti-percentage. But in compensation there are many hands where the slam fails on double dummy defense but the defense must find the right lead or defend very carefully. Strong players will test their opponents by bidding some slams that are technically marginal but on which their opponents could easily go wrong.
Poisson statistics show that in a 27 board session, your side has no double dummy slams only 16% of the time, one slam 29% of the time, two slams 27% of the time, three slams 16% of the time, and four or more slams 12% of the time. See the table below for more details. Is your partnership bidding and making enough slams?
Number of slams
24 boards
26 boards
27 boards
No slams
19.5 %
17.1 %
16.0 %
1 slam
31.9 %
30.2 %
29.3 %
2 slams
26.0 %
26.7 %
26.9 %
3 slams
14.2 %
15.7 %
16.4 %
4 slams
5.8 %
6.9 %
7.5 %
5+ slams
2.6 %
3.4 %
3.9 %
Bidding and making slam is a good test of partnership bidding, both in technical terms and in recognizing the slam potential, and also of declarer play. Stronger partnerships should have more successful slams. In addition, I expect that strong partnerships gain more against the field by bidding minor suit slams than major suit or notrump slams since minor suit slam bidding is more difficult.
We can test these hypotheses with the Payoff Matrix software because it tallies how often each partnership bids and successfully makes a slam as one of the many statistics it generates. It does this by looking for results like +980 that are valid slam scores consistent with the vulnerability. Some of the slam scores can also be generated by non-slam contracts. Most of the cases are crazy contracts like 2/* non-vulnerable making five overtricks (+980). Even 4/** non-vulnerable making on the nose (+920) is rather unlikely. We can assume non-slam results will have negligible impact on the slam totals.
Average matchpoint profit from bidding a slam
No doubt you’ve had that sinking feeling when the opponents bid and make a slam against you at matchpoints—that feeling that you are destined for a poor board quite often through no fault of your own. In the fairly strong La Jolla Unit game a slam bid and made against you will give you a 23% board on average. That drops your overall score 1.0% on average. In the Charlotte Bridge Studio 299er game, you will receive a 17% board on average because 299ers bid and make many fewer slams.
But enough negative thoughts. This chart shows the average matchpoint score in both games if you bid and make a slam.
Slam Type
La Jolla
Unit Game
Charlotte
299er Game
All Slams
77 %
83 %
No-Trump Slam
81 %
82 %
Major Suit Slam
75 %
82 %
Minor Suit Slam
79 %
88 %
Interestingly in the strong game, making a no-trump slam is worth more than making a minor suit slam even though the no-trump slam bidding is usually much easier. This is probably explained by matchpoint greed. Players will sometimes convert a high percentage suit slam into a lower percentage no-trump slam in the hopes of achieving a top board. The cases when this strategy fails are not reflected in the chart above because it only includes slams both bid and made.
This chart and the subsequent plots are based on the same data used for the partnership variability analysis. The La Jolla unit data is taken from the six year period from 2008-2013. The Charlotte 299er data is taken from the first ten months of 2013. Though the latter dataset covers a short time period, it includes multiple 299er games per week instead of just two games per month.
Slams per session bid and made
After applying a 20 session cut, the La Jolla unit game slam leaders are:
Partnership
Average
Slams/Session
NT%
Major%
Minor%
Suzanne LeBendig – Mac Busby
0.72
31
43
26
Steven Johnson – Diana Marquardt
0.67
26
54
20
Avram Ninyo – Susan Ninyo
0.65
11
62
27
Alan Gailfus – Debbie Gailfus
0.63
32
40
28
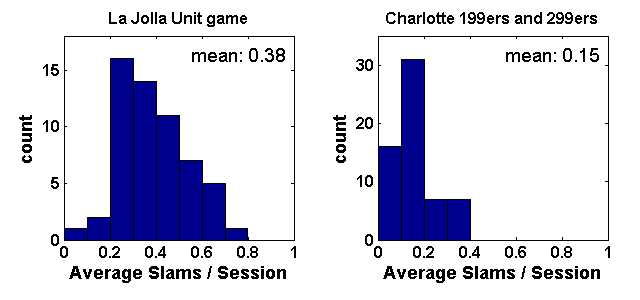
Observe that even the leaders are far below the double dummy theoretical limit of 1.84 slams in a 27 board session. Most partnerships are much farther below this limit. The following histograms show the average partnerships slams per session for after applying 20 and 15 session cuts respectively to the two datasets. Here 199er games have been added to the 299er games to increase the number of partnerships meeting the 15 session cut. Even the typical regular partnership in the La Jolla unit game is bidding and making only 0.38 slams per session.
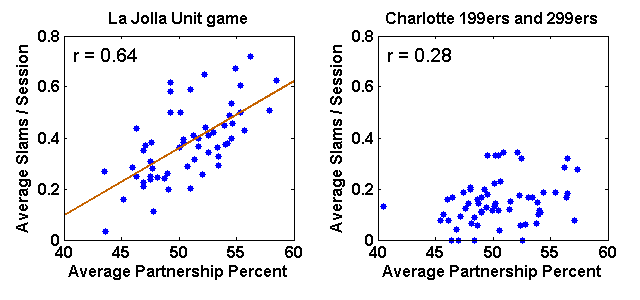
The stronger group of players is bidding more slams. Let’s look at that more closely by breaking it out separately for each game as shown below. Note the strong correlation (r = 0.64) in the La Jolla unit game. For example, on average a pair that scores 5% better per session bids and makes an additional 0.13 slams / session. As shown above, bidding a slam increases a partnership’s session score by 1.0% on average. So pair that is consistently 5% above average gains 0.13% of that advantage from superior slam bidding and play. Although this only accounts for 2.5% (0.13 / 5) of the reason why better players do better, every bit adds up.
The better partnerships in the 199er and 299er games are not bidding many more slams. They are still mastering decent card play and bidding good games.
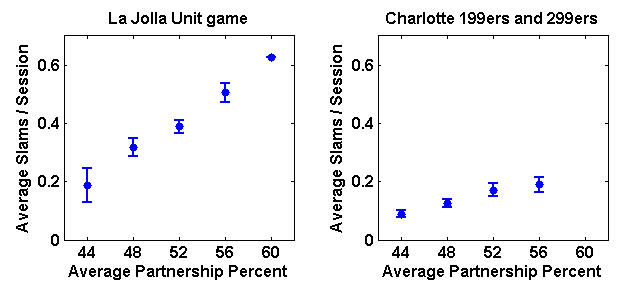
Binning the data in 4% bins as below simplifies the scatter plots above. The error bars are errors on the mean value for each bin.
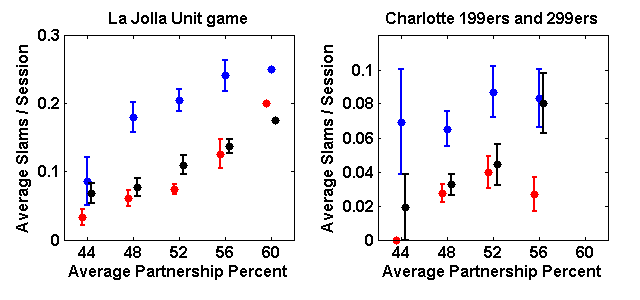
Breakdown by slam type
The figure below shows the breakdown by slam type where blue = major suit slam, red = no-trump slam, and black = minor suit slam. The horizontal positions are artificially staggered slightly to avoid error bar overlap; however the bin centers remain the same. Note that the vertical scale is different on the two plots.
Major suit slams predominate in both games. This isn’t surprising at all. Bidding is focussed on finding major suit games and no-trump at the expense of minor suit games. It is not hard to go from a major suit game to a major suit slam. Moreover, decent intermediates know Jacoby 2NT and splinter bids, good tools for uncovering 9+ card fits and any useful shortness. In the La Jolla unit game, stronger partnerships bid more major suit slams but there is only so much more to take from that mine. A bigger gain comes from bidding more no-trump and minor suit slams.
The 199ers and 299ers bid so few slams that the statistics are rather poor when broken out by slam type.
Double dummy slam statistics
Symmetry implies there must be as many minor suit slams as major suit slams even if they are harder to bid. However, one sometimes has a choice of slams and would choose the higher scoring slam if each had a similar chance of succeeding. The following table shows how often you have a choice of slam types based on a double dummy analysis of roughly 700,000 hands of which roughly 98,000 contain a slam (or grand slam) and roughly 21,000 contain a grand slam.
Category
All Slams
No Grand Slams
Grand Slams Only
No-Trump Only
1.37 %
1.74 %
0.52 %
Major Suit Only
23.54 %
27.61 %
22.64 %
Minor Suit Only
23.28 %
27.29 %
22.44 %
No-Trump and Major
9.98 %
9.15 %
12.86 %
No-Trump and Minor
9.95 %
9.10 %
12.64 %
Major and Minor
12.73 %
12.95 %
8.04 %
NT, Major and Minor
19.15 %
12.16 %
20.86 %
All percentages includes slams that must be right-sided to make, a fairly small fraction. Major suit means a slam can be made in spades, hearts, or both spades and hearts; similarly for minor suit slams. The “All Slams” column includes both slams and grand slams. The “No Grand Slams” column is restricted to cases when no grand slams are available in any suit. The “Grand Slams Only” column is restricted to cases where all making slams are grand slams.
By symmetry, the true Major Suit Only and Minor Suit Only percentages must match and so too must the No-Trump and Major and No-trump and Minor percentages. But rather than averaging them, I’ve left them as they are as an indication of the accuracy that comes from sampling 700,000 or so hands, an accuracy of better than 0.3%. This is approximately what one would expect since the statistics are based on roughly 98,000 slam hands and √98,000 ⁄ 98,000 gives an expected fractional error of 0.32%.
Occasionally one sees a hand where declarer is alerted to a first round ruff by a Lightner double and converts the contract to 6 NT, which then makes with good play. But amusing as such hands are, the chart above shows just how rare it is for no-trump to be the only double dummy slam denomination.
60% of the time (23.54 + 23.28 + 12.73) it is essential to play in a suit slam but 40% of the time it suffices to play in no trump. However, this does not mean you should get too greedy at matchpoints. Trump offers the chance to succeed by ruffing losers with the hand short in trump, ruffing in either hand to setup a suit, or somewhat less commonly ruffing with the hand long in trump for a dummy reversal. These plans are often simple and they do not exhaust all the options available with a trump suit. The double dummy line in no-trump is more likely to require an endplay or a good guess, e.g. which of two suits to finesse. The double dummy analyzer never gets these guesses wrong but a real declarer will.
Double dummy, one or more grand slams are available for 2.94% of hands. This means your side has one on just under 1.5% of hands. Poisson statistics show that in a 27 board session one or more grand slams are available to your side 33% of the time.
When no grand slams are available on a hand, it is more often necessary to play in a suit slam. It works out to 68% (27.61 + 27.29 + 12.95) of the time instead of the 60% when all slam hands are considered.
The highest scoring slam
At IMPs you want to play in the safest slam. Even at matchpoints this is a pretty sound strategy because the slam will not even be bid at many tables. Why enhance your risk of going down and losing to all the pairs just for the chance to improve against the few pairs that reach any slam? The field needs to be very strong and the slam needs to be fairly obvious before a conversion to higher paying but less safe slam is merited.
Still, suppose for a moment that you could declare double dummy. What would be your breakdown of slam types? The answer works out to be 35.3% no-trump, 38.4% major, and 26.3% minor. But this assumes you always bid grand slams. If you never bid grand slams, or equivalently just never bid minor suit grand slams, instead only collecting the overtrick value, the breakdown changes to 38.9% no-trump, 39.0% majors, and 22.1% minors.
How much do you risk on average in converting a double dummy suit slam to a no-trump slam? We could look at this by selecting slam hands and freezing the offensive cards while randomly permuting the defensive cards many times to see how often the suit and no-trump slams make double dummy with the different layouts. This is computational feasible now for a statistically meaningful set of hands. Stay tuned.


