Source: ACBL
The “expected” frequencies of Hand Patterns listed below are from Borel and Cheron’s The
Mathematical Theory of Bridge, and repeated in Antonio Vivaldi and Gianni Barracho’s
Probabilities and Alternatives in Bridge. The first column of the tables gives the possible
distributions of bridge hands – the 14 most common of 39 total. The funny “seven-Other” shown in the left column refers to all hands containing a seven-card suit but not already listed (“six Other” means the same, six-card suits not listed). The second set of columns are Suit Pattern frequencies.
Note that both books assume hand and suit pattern probabilities to be the same.
Hand Patterns (suit distributions) Suit Patterns (same as Hand Patterns!)
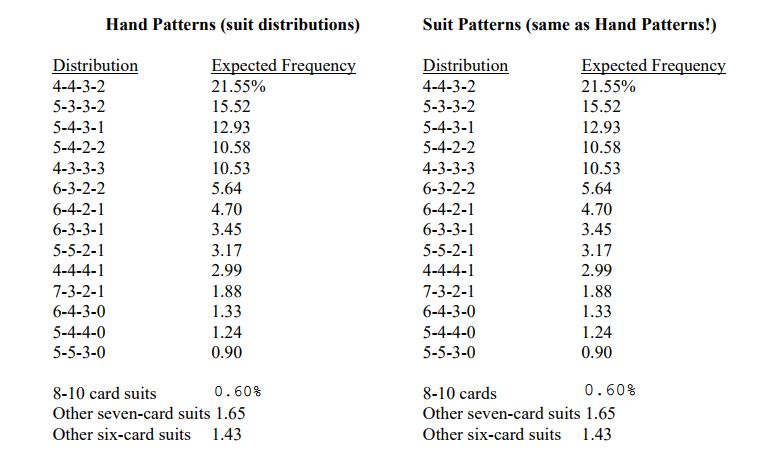
A Hand Pattern is how the 13 cards you own are distributed in suits. A Suit Pattern is how
the 13 cards of any suit might be distributed around the table in the four hands. By these tables, the frequency of any random individual Hand Pattern and Suit Pattern is the same!
So, of the 39 possible distributions, what are the most common patterns?
The “balanced” patterns: 4-4-3-2, (21.55%); 5-3-3-2, (15.52%); 5-4-2-2 (10.58%) and 4-3-3-3, (10.53%) constitute 58.18% of all hands dealt. When you add the 6-3-2-2, and 7-2-2-2 patterns, you can see two thirds of all random dealt hands have no short suits – singletons or voids. Or, if you like, one third of all hands have at least one short suit – singleton or void – occasionally both.
Interesting how the 4-4-3-2 (21.55%) pattern is the most dominant, and the 4-3-3-3 pattern is less than half as dominant (102 %) and less frequent than the 5-4-2-2 and 5-4-3-1 patterns.
Also, interesting how the 5-4-3-1 (unbalanced) pattern is number 3 in frequency.


